
 athexgroup.gr


Financing and Financial Investment of the non-financial sectors in the euro area in the third quarter of 2003

Highlights:
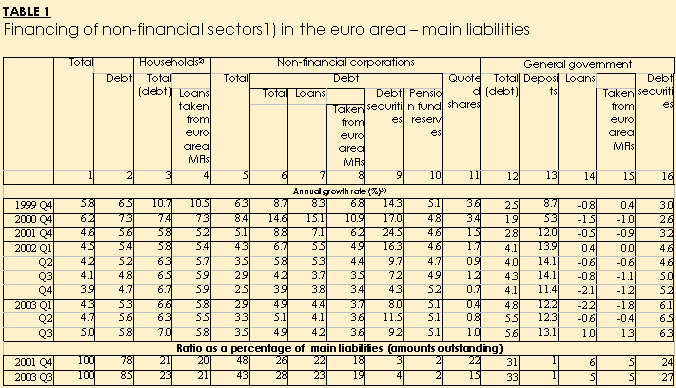
- In the third quarter of 2003, the annual growth rate of financing of the non-financial sectors in the euro area rose to 5.0%, up from 4.7% in the previous quarter (see Table 1). The annual growth rate of debt financing also increased, to 5.8% in the third quarter of 2003 up from 5.6% in the second quarter of 2003, and the annual growth rate of quoted shares issued by non-financial corporations rose to 1.0%, up from 0.8%.
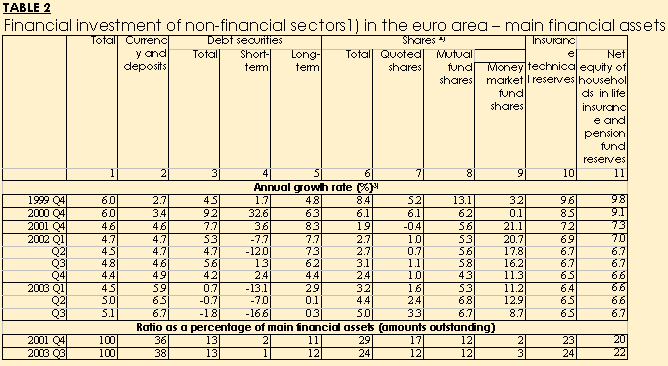
- The financial investment of the non-financial sectors remained broadly stable at 5.1% in the third quarter of 2003 (see Table 2).
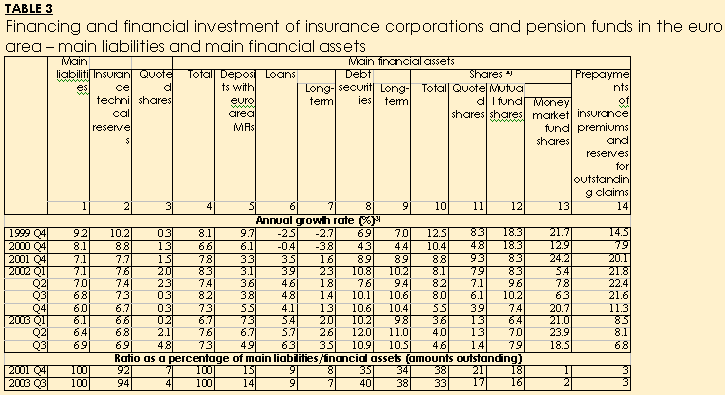
- The annual growth rate of financing of insurance corporations and pension funds in the euro area increased to 6.9% in the third quarter of 2003 up from 6.4% in the previous quarter (see Table 3).
With regard to the financing of the individual non-financial sectors, the annual growth rate of debt financing by households increased to 7.0% in the third quarter of 2003, from 6.3% in the previous quarter. The annual growth rate of financing by non-financial corporations increased to 3.5% in the third quarter of 2003, up from 3.3% in the second quarter of 2003. This is partly related to a rise in the annual rate of growth of quoted shares issued, to 1.0% from 0.8% in the previous quarter. By contrast, the annual growth rate of debt financing went down to 4.9%, from 5.1% in the second quarter of 2003. The annual growth rate of general government debt financing remained broadly stable, at 5.6% in the third quarter of 2003.
As for financial investment of the non-financial sectors, the annual growth rate of investment in currency and deposits went up to 6.7% in the third quarter of 2003, compared with 6.5% in the previous quarter. The annual growth rate of investment in shares rose to 5.0% in the third quarter of 2003, from 4.4% in the previous quarter. By contrast, the annual rate of growth of investment in debt securities decreased further to -1.8%, down from -0.7% in the previous quarter. Finally, the annual growth rate of households? investment in life insurance and pension fund reserves remained broadly stable at 6.7% in the third quarter of 2003.
The annual growth rate of insurance technical reserves, the major financing instrument of insurance corporations and pension funds, remained broadly stable at 6.9% in the third quarter of 2003. Their annual rate of growth of financial investment in deposits and debt securities declined, more than compensating for the rise in the annual growth of investment in shares and of loans granted.
A more detailed set of quarterly data starting in the fourth quarter of 1997 is published in Table 3.1, Table 3.2 (non-financial sectors) and in Table 3.3 (insurance corporations and pension funds) of the "Euro area statistics" section of the ECB's Monthly Bulletin. The corresponding quarterly data are also made available on the "Euro area statistics - download" page in the "Statistics" section of the ECB's website (http://www.ecb.int) and can be downloaded as tables (pdf files) and as csv files. In the website is also available a detailed methodological description of the data.
Source: ECB.
The financing and financial investment of non-financial sectors and insurance corporations and pension funds in the euro area (as shown in Tables 1, 2 and 3) cover most of the ESA 95 financial asset and liability categories. Financial derivatives, loans granted by general government and non-financial corporations, unquoted shares, other equity, and other receivables and payables are not yet included. This also applies to deposits held by the non-financial sectors with banks abroad and loans received from them.
1) Non-financial sectors comprise households (including non-profit institutions serving households), non-financial corporations and general government.
2) Including non-profit institutions serving households.
3) Ratio of accumulated transactions over the last four quarters to the corresponding outstanding amount of financial assets or liabilities one year ago at the end of the quarter.
4) Excluding unquoted shares.
 Search
New Listings Prospectuses
 ΙΝΤΡΑΛΟΤ_ΕΔ.pdf
  AUTOHELLAS_PROSPECTUS.pdf.crdownload
 Laws and Regulations
 Resolution No 22 Regulation of Technical Matters for Trading on ATHEX Markets 22042024
 Links
Market
Composite index

 FinancialCalendarPortlet
Asset Publisher